Share of shelf in FMCG: how to measure it and why it matters
Share of shelf is not just how much space we have on the shelf. It measures visibility, competitive position and the chance the product will be chosen at the moment of purchase.

In FMCG, presence on the shelf is not enough.
The product can be available but almost invisible. It may have one facing, low on the shelf, between competitors, without brand block and without a real chance to be noticed.
That is why share of shelf matters.
It shows not only whether the product is there, but how strongly it is present in the category.
Visibility is commercial currency.
What share of shelf means
Share of shelf measures how much of the shelf space in a category is occupied by a brand, product or portfolio.
It can be measured in several ways:
- number of facings;
- linear shelf space;
- shelf area;
- brand block;
- eye-level presence;
- share versus competitors;
- weighted share by outlet importance.
The simplest measurement is facings share:
brand facings / total facings in category
But that is not always enough.
Facings are not everything
Two brands can have the same number of facings but different real visibility.
Reasons:
- one is at eye level;
- the other is low;
- one has a full block;
- the other is scattered;
- one is near promotion zone;
- the other is at the edge of category;
- one is in a high-traffic store;
- the other is in a low-potential outlet.
That is why a good share of shelf KPI should also look at position quality.
Weighted share of shelf
Share of shelf in a small outlet and share of shelf in a key high-potential outlet do not have the same weight.
Weighted share can help:
- by outlet potential;
- by category;
- by channel;
- by promotion period;
- by strategic importance;
- by shopper traffic.
Then the manager does not only see an "average percentage", but understands where lost visibility is most expensive.
Share of shelf versus sales
Share of shelf is most useful when it is viewed together with sell-out, distribution and execution score.
By itself, it does not give a full diagnosis.
For example:
| Situation | What it may mean |
|---|---|
| High share, low sales | wrong assortment, weak price, weak category potential |
| Low share, high sales | missed potential, need for more facings |
| Low share, low sales | weak standard or low outlet importance |
| High share, high OOS | shelf position is good, but replenishment/order process is weak |
That is why AI Order Brain and share-of-shelf analytics should not live separately. If an SKU has high potential, low share and frequent OOS situations, the recommended order should account for it.
In the same way, Chat BI should allow questions such as: "Where do we have high market potential, but low share of shelf and low order fill?" That is much more useful than one average percentage.
Competitive pressure
Share of shelf is almost always a competitive KPI.
If your share falls, somebody else's share often grows.
Good diagnostics should show:
- which competitor increased facings;
- whether the change is permanent or promotional;
- whether there is secondary placement;
- whether there is a price attack;
- whether the decline is limited to one channel;
- whether the problem comes from a specific chain or region.
This changes the conversation. We no longer ask only "why did our share fall", but "who took it, where, when and with which mechanic".
Then shelf data becomes commercial intelligence, not just photo audit.
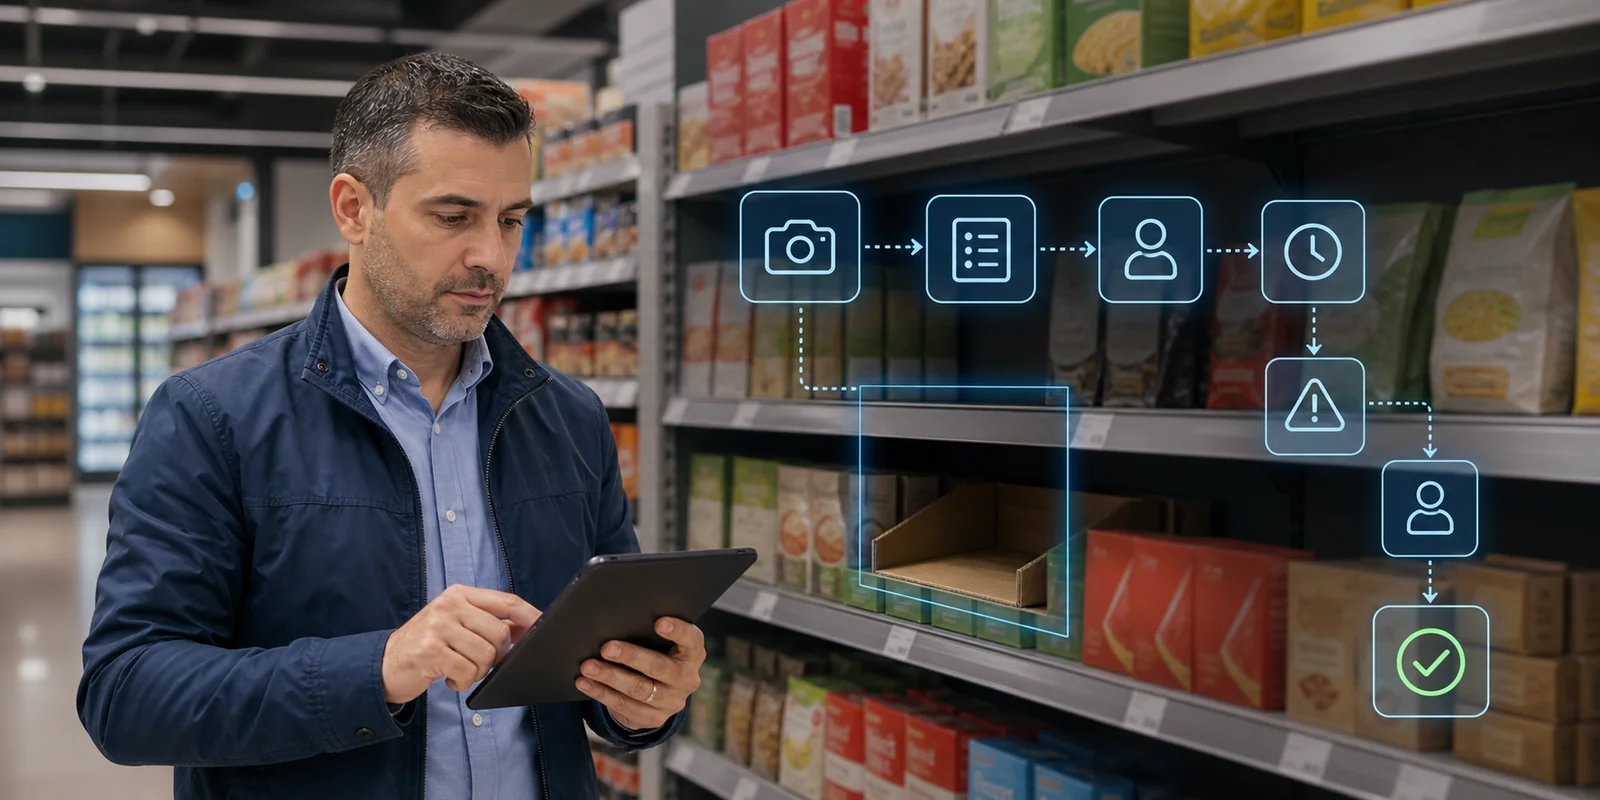
How computer vision helps
Manual share of shelf measurement is hard:
- it takes time;
- it is subjective;
- it is hard to scale;
- it rarely happens often enough;
- it is hard to compare over time.
Image recognition can turn the photo into a measurable shelf signal:
- recognizes products;
- counts facings;
- finds category boundary;
- measures blocks;
- detects position;
- compares with previous images;
- detects share decline.
Shelf computer vision shows the broader pipeline behind this.
Share of shelf as action
Knowing that share is falling is not enough.
The business needs to know what to do:
- recover facings;
- protect brand block;
- escalate to supervisor;
- change Perfect Store score;
- trigger coaching;
- connect to next order;
- check competitor promotion.
Without action, share of shelf is only analytics.
Which action follows a decline
A share-of-shelf decline should trigger different actions depending on the reason.
If the reason is OOS, the solution is order or replenishment.
If the reason is competitor promotion, the solution may be trade marketing action.
If the reason is poor arrangement, the task goes to the sales rep or merchandiser.
If the reason is weak standard across a chain, it may be a key account topic.
That is why Workflow orchestration matters. The same KPI can lead to different owners. Without workflow, all deviations become identical tasks, and that is not a managed process.
From data to action explains this model more broadly: the signal needs owner, deadline, proof and learning.
In short
Share of shelf in FMCG shows how strongly the product is present at the moment of purchase.
Strong measurement includes:
- facings;
- shelf space;
- position;
- brand block;
- competitor pressure;
- weighted outlet importance;
- trend over time;
- action when share drops.
The product should not merely be on the shelf.
It should be visible enough to have a chance to be chosen.
Related in Optimasoft
- Image recognition measures facings, shelf blocks and share-of-shelf signals from an image.
- Shelf computer vision explains how shelf image becomes measurable signal.
- Perfect Store scorecard places share of shelf inside the store standard.
- Planogram compliance shows how shelf share connects to the planned standard.
- Retail Execution KPI places SoS in the broader KPI framework.
Sources
- NielsenIQ - Total Distribution Points and CPG brands
- Computer Vision Based Planogram Compliance Evaluation - Applied Sciences
- A comprehensive survey on computer vision based approaches for automatic identification of products in retail store - Image and Vision Computing
- Bain & Company - Perfect Store: How advanced analytics is transforming sales execution
Related articles